

A New Housing Affordability Index that Reflects the True Cost of Ownership
The Burnham-Moores Center for Real Estate at the University of San Diego's Knauss School of Business has launched a quarterly Housing Affordability Index that better reflects the true cost of homeownership, not just mortgage payments. Unlike the popular REALTOR index, this model incorporates insurance, taxes, utilities, maintenance and other essential expenses, measured against owner and renter incomes, offering a more comprehensive snapshot of housing affordability trends. It is, as presented, a renter to owner transition index. We do not compare these costs to rental options, that might be lower in many markets. It covers 385 US metro markets.
The index was developed by Norm Miller, Ernest W. Hahn Chair of Real Estate Finance, Emeritus, at the Knauss School of Business along with Ian Kennedy.
For the Media
Contact press@sandiego.edu.
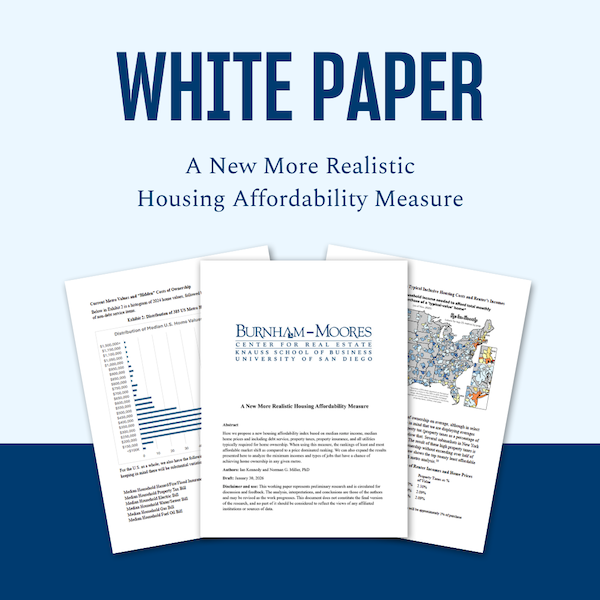
White Paper
Updated August 3, 2026.
Access the white paper proposing a new more realistic housing affordability index.
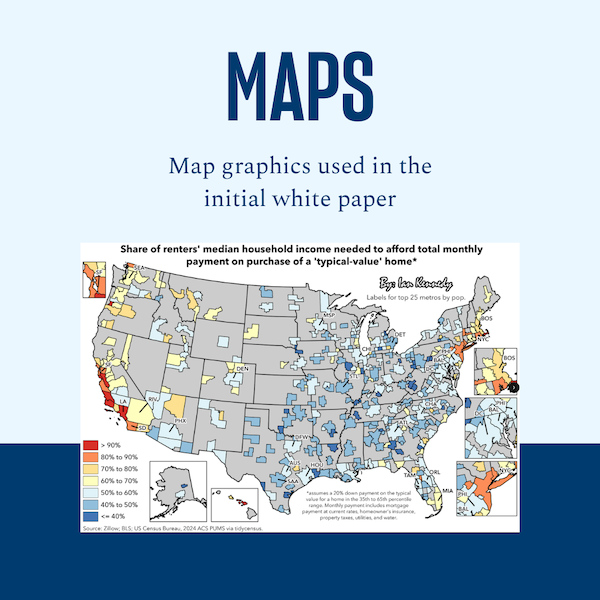
Maps
Updated April 27, 2026.
Access the map graphics used in the new housing affordability index.
Data
Updated August 3, 2026.
Access the initial dataset used in the new housing affordability index.
Motivation
Most housing affordability indices focus on price, median incomes and mortgage payments, all of which are included here, although we utilize renter median incomes in our rankings of relative ownership costs. In some regions we notice that property insurance costs are a major cost. For example, in Florida or Tornado Alley and along the Gulf coast the cost to insure a home are several times that of other regions. In New Jersey, New York and Illinois we observe property taxes as double those in many other parts of the country relative to home value. Both of these non-mortgage costs show significant variation by market and overtime. We plan to update these costs annually along with renter incomes and to quarterly adjust prices and mortgage rates.
Results
In the first quarter of 2026 our results suggest that less than 12% of all CBSAs require less than 40% of renter household income in order to consider home ownership, given this more holistic measure of occupancy costs. While most of the most expensive markets are in California, we also find several smaller markets as less attainable. When considering property insurance costs, most of the most expensive markets are in Louisiana and Texas, Oklahoma and Mississippi. All of the top ten most expensive places for property taxes are in New York, Illinois, and New Jersey. While California may have the highest electric rates, after Hawaii, these markets require less heating and cooling, and utilize more solar, and that is why West Virginia, Arkansas, Ohio, Texas, Oklahoma, Illinois, Alabama and Pennsylvania top our list of high utility bills. New England states are the only area still using expensive fuel oil, but these same homes often use natural wood heating systems as well, which is not part of our database.