
How are we doing?
Employment and income received a worsening rating largely due to the standing gap between wages and the high cost of living. In recent years, San Diegans have felt compressed by rising unemployment and inflation. Regional unemployment has stabilized and some sectors are seeing a growth in jobs, such as private health and education services, which experienced an addition of over 17,000 jobs between 2025 and 2026. The median household income in San Diego was $123,519 in 2024, just above the self-sufficiency wage of a family of four, or $120,287. This suggests that just under half of San Diego households of this size did not earn enough to cover their basic needs. Income disparities persist across gender and race as well. The San Diego region remains one of the most expensive areas in the country.
Rating: Worsening
High cost of living is squeezing wages
Employment in San Diego
The global COVID-19 pandemic caused acute social and economic disruption, causing unemployment to peak at nearly 16% in San Diego County. The region lost 233,900 jobs during this time and recovered the number of jobs in November 2021. Job growth started to slow in 2023, with unemployment increasing from 3.5% in the first quarter to 4.4% in the fourth quarter. In 2025, unemployment rose up to 4.9%, a level not seen since 2021. Still, unemployment levels remain stable and within the bounds of the natural unemployment rate of 4 to 5%.
*Defense is listed separately from the Federal Government to show the size of the sector.
As of January 2026, the largest sectors were private education and health service, professional and business services, and trade, transportation, and utilities. Between 2025 and 2026, private education and health services sector saw a growth of more than 17,000 jobs, which is a 6.5% increase.
Affording to live in San Diego
San Diego is one of the least affordable metropolitan areas to live in the country. The 2025 Demographia International Housing Affordability rated San Diego as “impossibly unaffordable”, meaning a typical home costs over nine times what a typical household earns in a year. Despite the high cost of living in the region, it is home to over 3.2 million residents. These include households of various sizes and backgrounds. The Self-Sufficiency Standard defines the income that working individuals and families “need to meet a minimum yet adequate level” of quality of life according to the size of the household, ages of children (if any), and where they live. Comparing actual earned household income to these standards show whether San Diegans earn enough to live comfortably in the region.
In 2024, a household with the size of two adults and two school-age children needed to earn $120,287 to sustain a comfortable lifestyle. In 2014, this figure was $63,356, indicating that it is now almost twice as expensive to raise a family of this size than compared to ten years ago. According to the U.S. Census, the median household income for families with children under the age of 18 was $123,519 in 2024, which suggests that just under half of these families do not earn enough to cover their basic needs comfortably.
For the self-sufficiency standard of households of smaller or larger size, visit the Center for Women’s Welfare Self-Sufficiency Standard. For insights into the cost of living for older adults, visit the California Elder Index (CEI) Cost of Living Dashboards.
Looking at single-parent families, there are significant income differences. In 2024, single mothers earned about $52,000 per year, compared to about $83,000 for single fathers, a gap that has remained largely unchanged in recent years. At the same time, the estimated cost of meeting basic needs for one adult and one school-age child in San Diego is about $89,000 per year. This means more than half of single fathers fall short of affording all basic needs and significantly more single mothers struggle to meet basic needs. As a result, many single parents struggle to cover everyday expenses, with single mothers facing the greatest challenges. To put this into perspective, before and after school childcare programs and all-day summer programs can cost parents $1,254 a month, or about $15,000 a year.
In 2024, the median household income in San Diego was $106,268, which is greater than the median household incomes of American Indian and Alaska Native, Hispanic or Latino, and Black or African American communities. The median income represents the exact half-way point of a community's lowest and highest income levels. Therefore, it is more likely that these communities are experiencing financial challenges.
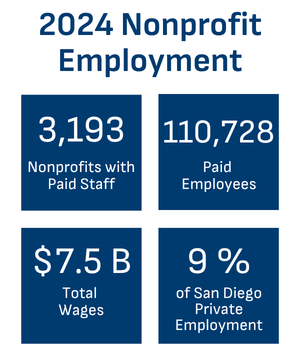
Employment in the nonprofit sector
Nonprofits contribute significantly to the San Diego workforce, with 9% of workers employed in the sector in 2024. These include employees at hospitals, universities, museums, clinics, performing arts centers, pet shelters, and many other establishments. Nonprofit workers are the backbone of essential services and, in many cases, are the first to respond to challenges and disasters in the region.
During the fall 2025 federal government shutdown, SNAP benefits were delayed and San Diego nonprofits stepped up to meet increased demands for food assistance. Many nonprofit employees find their work meaningful, but the strain of inadequate compensation is causing some to consider leaving the sector.
U.S.-Mexico Border Region
Generally speaking, unemployment levels in Baja California are lower than Mexico’s overall unemployment rate. Average quarterly unemployment in Baja California was 2.4% in 2025. The rate of informal occupation increased, with about 658,000 individuals working in the informal sector. These jobs include street vendors, temporary agricultural workers, house cleaners, or mechanics. The rise in unemployment over the past year could be attributed to declines in the construction sector as tariffs imposed by the U.S. affected steel, copper, and other materials.
Related Indicators
- Housing
- Transportation Choices
- SEEN
Individuals spending more than 30% of their income are considered housing burdened. Learn more about the cost of homeownership and renting in San Diego.
Why is employment and income important?
High quality of life means the region boasts a thriving economy and a healthy environment accessible to all in the community.
Economy
Employment and income both influence production and consumer demand in an economy. When people are employed, they have income to purchase goods and services, growing economic activity. However, fluctuations in the economy may slow hiring or stall wage growth, for instance, in San Diego’s tech economy. Additionally, if the cost of basic needs are high, people will spend less on other goods and services.
Environment
The conditions of the environment can affect the availability of food and the economic well-being of communities. Severe weather, pests, and changing climate reduce the production of popular beverage and food crops like coffee, increasing prices for the consumer. At a societal level, economic growth fosters environmental concerns while also increasing environmental footprints, highlighting a paradoxical relationship for communities that enjoy relative wealth.
Equity
Nearly 35% of San Diegans live in households that do not make enough to afford basic expenses. Financial barriers to stability and well-being vary household to household. Initiatives to improve affordability of and access to basic needs, upskill workers, and updating minimum wages could reduce the number of households in this category.
Regional Response
Policies
The City of San Diego increased the minimum wage to $17.75 an hour. In the rest of the county, minimum wage increased to $16.90 an hour. Chains with more than 60 locations nationwide must pay their workers at least $20 an hour. Service workers also have the right to keep 100% of their tips.
In Fall of 2024, Governor Newsome signed SB 988, a bill protecting freelance workers by requiring the hiring party to pay compensation in a timely manner.
The California Pay Transparency Law (SB 1162) requires California employers to provide explicit pay ranges on job listings, limiting financial confusion for individuals who are seeking well-paying jobs.
Projects
Local nonprofits with programs improving professional development and access to financial freedom and entrepreneurial success.
City Heights Community Development
Partnerships
The #CaliforniasForAll College Corps Fellows initiative creates debt-free pathways for college students admitted to the program. This initiative launched in 2022 in partnership with 46 California colleges and universities. Fellows at San Diego colleges will earn up to $10,000 while providing impactful community service and capacity to organizations in the region.
What are we tracking?
We track the quarterly trend in unemployment rates in San Diego County, California and the U.S. as reported by the Bureau of Labor Statistics. We also track the number of total jobs in different job sectors of San Diego. We also compare median incomes of various households determined by the U.S. Census to the Self-Sufficiency Standard, a project of the Center for Women's Welfare housed at the University of Washington. The Nonprofit Institute collects annual data on the state of employment in San Diego’s nonprofit sector. Unemployment data in Tijuana and Baja California is reported by the Mexican National Institute of Statistics and Geography (Instituto Nacional de Estadística y Geografía). Learn more about the data.